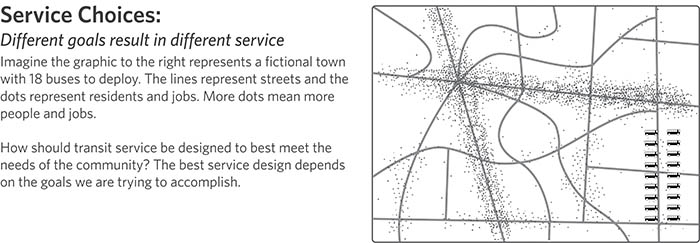
We ask public transit to meet many goals, and sometimes these conflict with one another. We need your help determining what our priorities should be for bus service in your community.
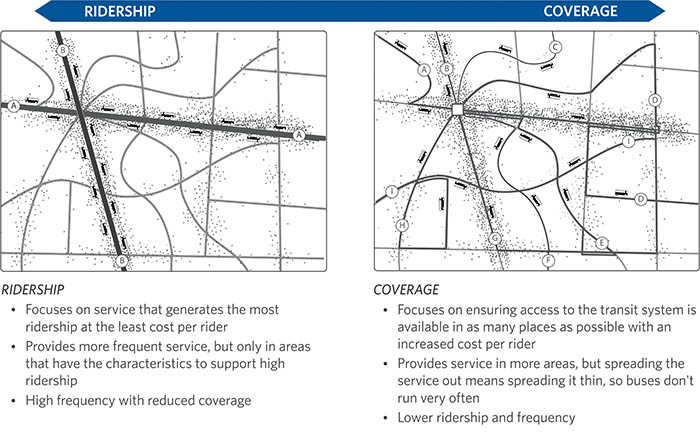
Two of these conflicting goals are: Ridership (attracting as many riders as possible) and Coverage (being available in as many places as possible, even if not many people ride). Both goals are both important, but they lead in opposite directions. UTA is asking the community to help determine the appropriate balance between ridership and coverage.
What should be the Priorities for UTA's Bus Service?
Transit is asked to serve many different goals, including:
- Reduce traffic congestion
- Improve air quality
- Stimulate development in urban centers
- Provide an affordable transportation alternative to driving
- Get people to jobs and school
- Provide service to everyone who pays for transit
- Connect people to social services
UTA has a limited budget, so doing more of one thing can mean doing less of another. That’s why UTA has sought input from the community about their priorities.
Two of these conflicting goals are: Ridership (attracting as many riders as possible) and Coverage (being available in as many places as possible, even if not many people ride). Both goals are both important, but they lead in opposite directions. UTA is looking to make updates to the bus network based on community input regarding the appropriate balance between ridership and coverage.
Learn more from available resources to the right.
Return to Service Choices main page